The Javascript debugger is a great tool for seeing how an application or page behaves or solving a problem when it’s not behaving the right way – without consoie.log all over the place. In this article we will have a look at how it is used.
Let’s have a look at how you would use the JS debugger to understand how a page works (maybe you’re not the one who wrote it, but needs to debug it!)
Here’s the following page:
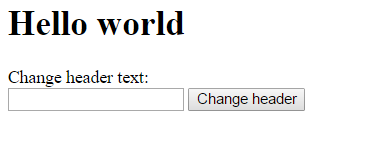
This page is very simple: you just type a value in the text field and click on ‘change header’ and the text in the header changes to whatever you typed in your text box. Let’s use the JS debugger to examine how it actually works.
First of all, let’s bring up the JS debugger. This can be done simply by bringing up the chrome developer tools (ctrl+shift+I, or right click the page and click ‘inspect element’), and then clicking ‘sources’. You now need to find the javascript file that is being used, which for our case is test.js, and click on it.
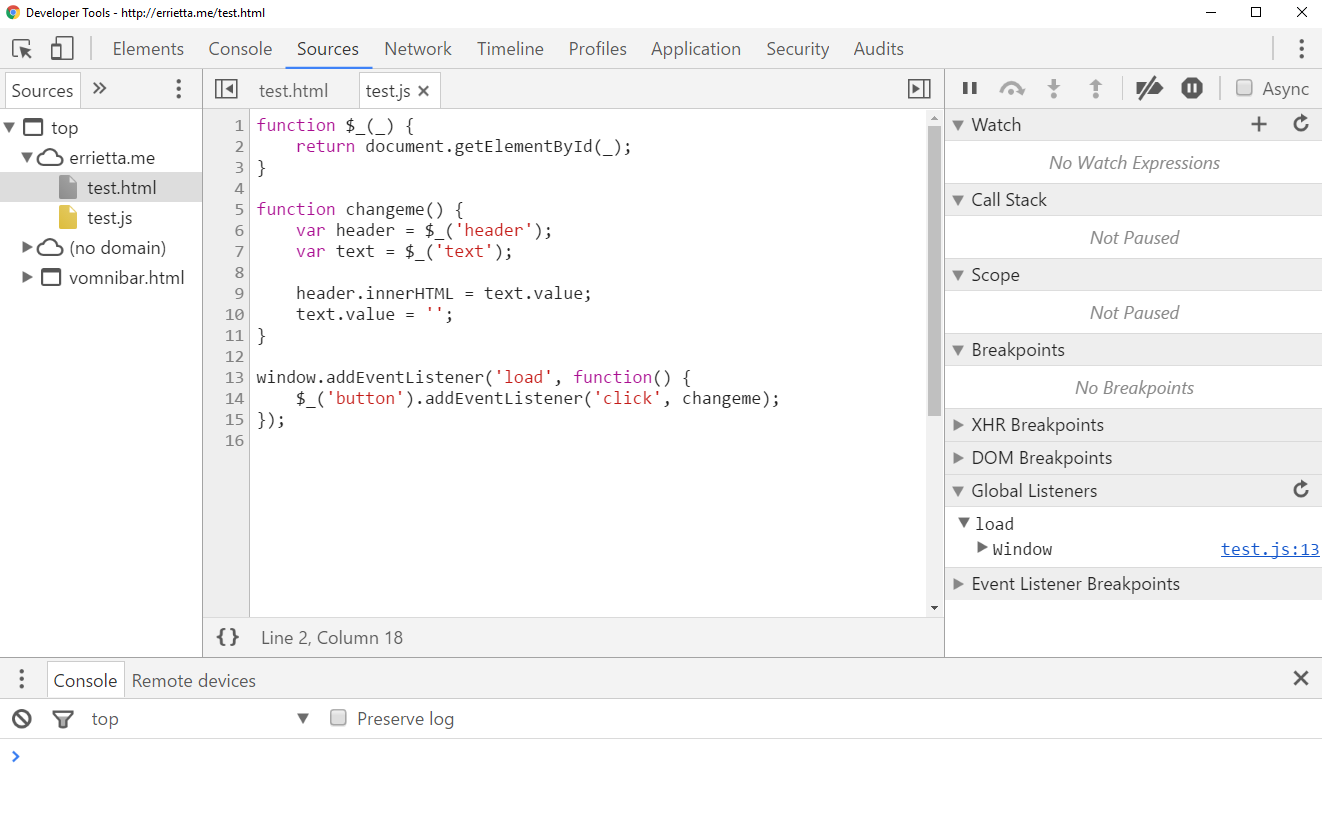
Yes, it’s a very dumb script and we’re re-inventing the wheel with ‘$_’, but that’s not the point here. Let’s have a look instead at what the various things in the debugger do.
A trained eye will of course be able to understand what’s going on by just reading the script, but let’s pretend that it’s not so easy because we’re dealing with a much bigger, much more complicated page.
Spotting event listeners
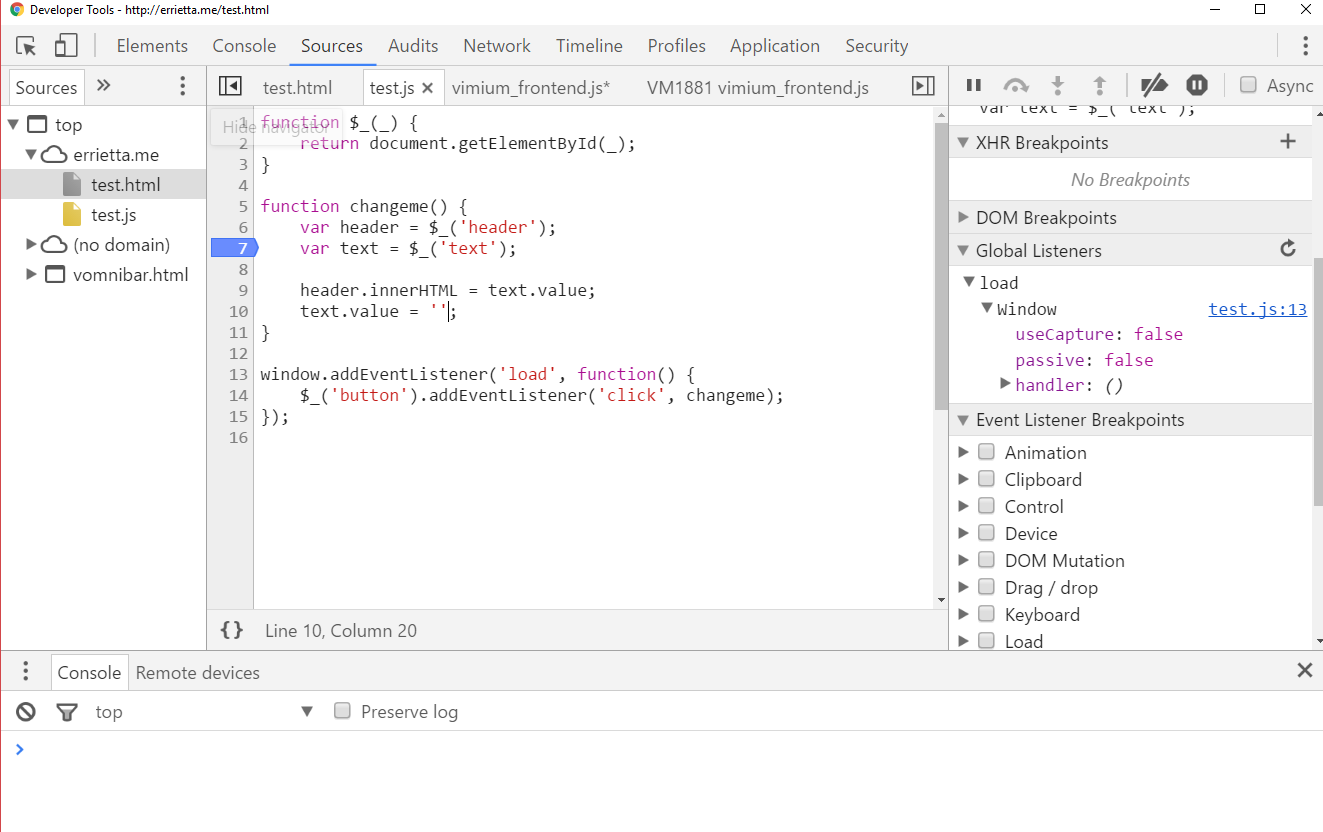
Obviously, we know that the text changes when we press the button, so the first thing I would do is to look for event listeners. If you look at the Chrome console, there is a ‘global listener’s section on the right hand side. Ok, so we don’t see our click listener yet, but there’s the listener for ‘load’.
If you click the ‘Window’ under the ‘load’, you get the option to remove the listener, and also some information about the event:
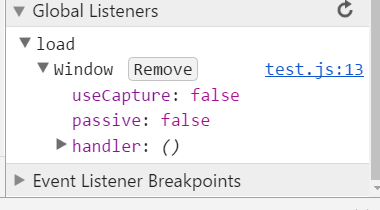
The easiest way to understand what the event does is to right click on ‘handler’ , and click ‘show function definition’. The JS debugger will then scroll to the part of the script where the event listener is, and highlight, of course, our window.addEventListener(‘load’, function() { .. }) code, indicating that that’s the function we want to look at.
Another way to easily spot event listeners is adding a breakpoint on specific types of listeners, which means that the javascript execution will stop when one of those listeners is triggered. Let’s try that out!
In ‘event listener breakpoints’, you can scroll down to ‘mouse’ and click (heh) ‘click’
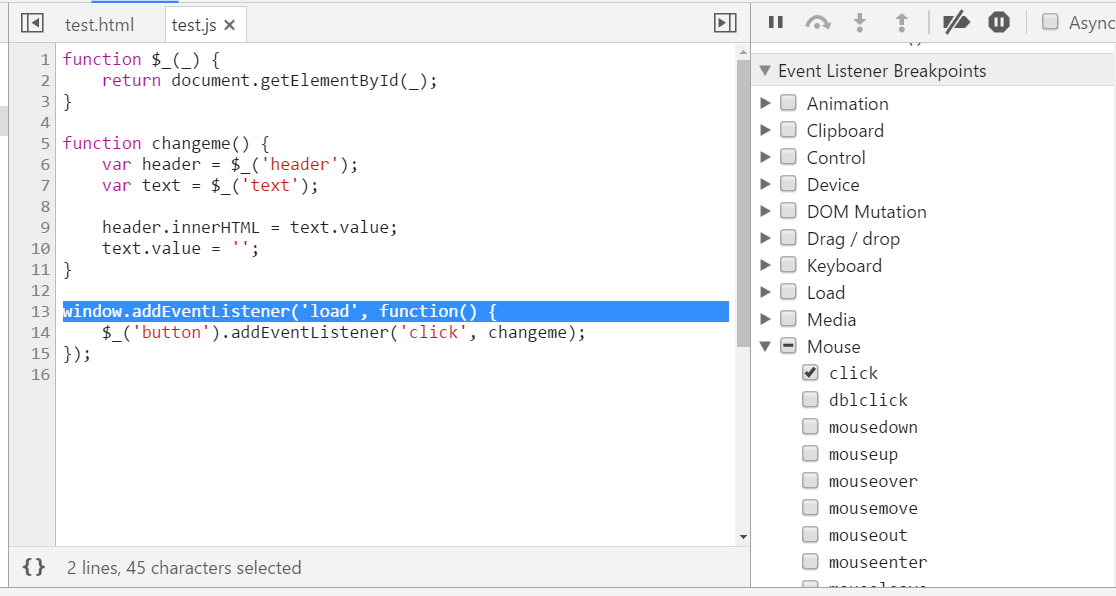
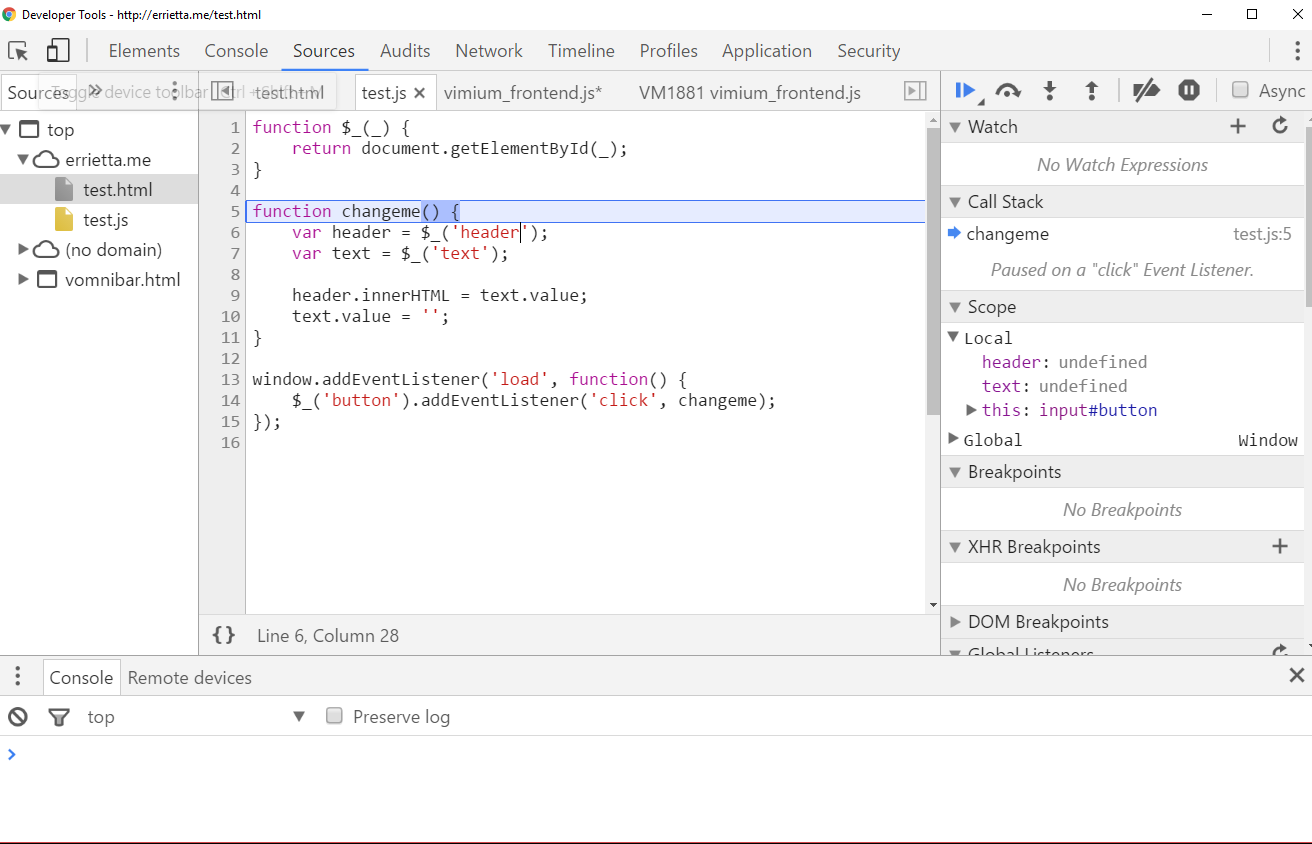
Then as soon as you click the button on the page, you will see that the javascript execution is paused, and your debugger will highlight the ‘changeme()’ function in blue, hinting that execution has stopped at that point. This means that that function is being called when the button is clicked – and you now know how the button works and what the function does! (the ‘paused on a “click” event listener’ on the right explains why it stopped to make things less confusing as well)
I’ll get to how to take advantage of breakpoints shortly, but first I want to get to a few more ways of adding breakpoints.
Adding break points
So you can trap certain kinds of events, and you’ve probably noticed the ‘pause’ icon on the top right which will just make your code stop when you catch an exception, but what other ways of adding break points have we got?
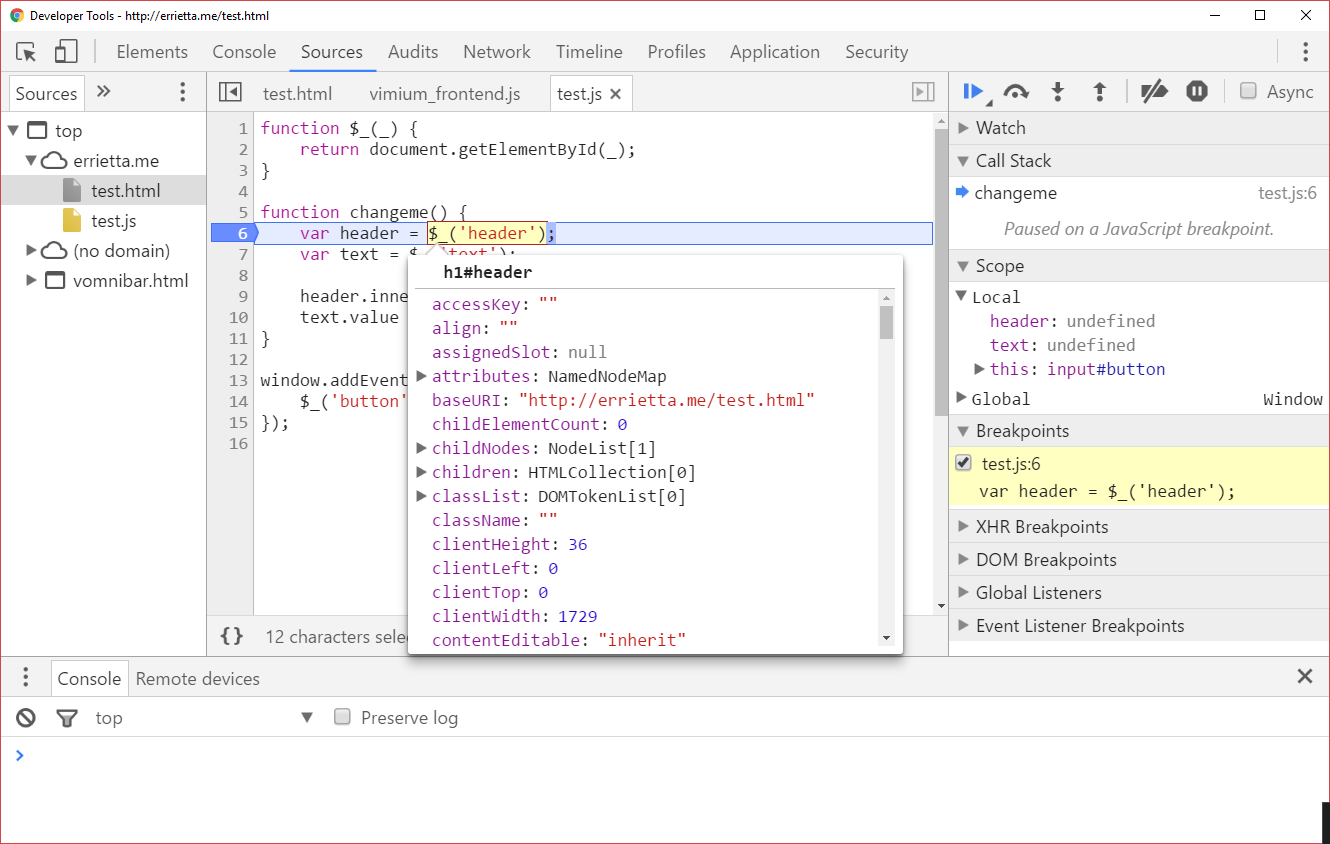
You can make your javascript code stop at any one line by simply clicking on that line in the debugger (you can remove it the same way if you don’t need it later):
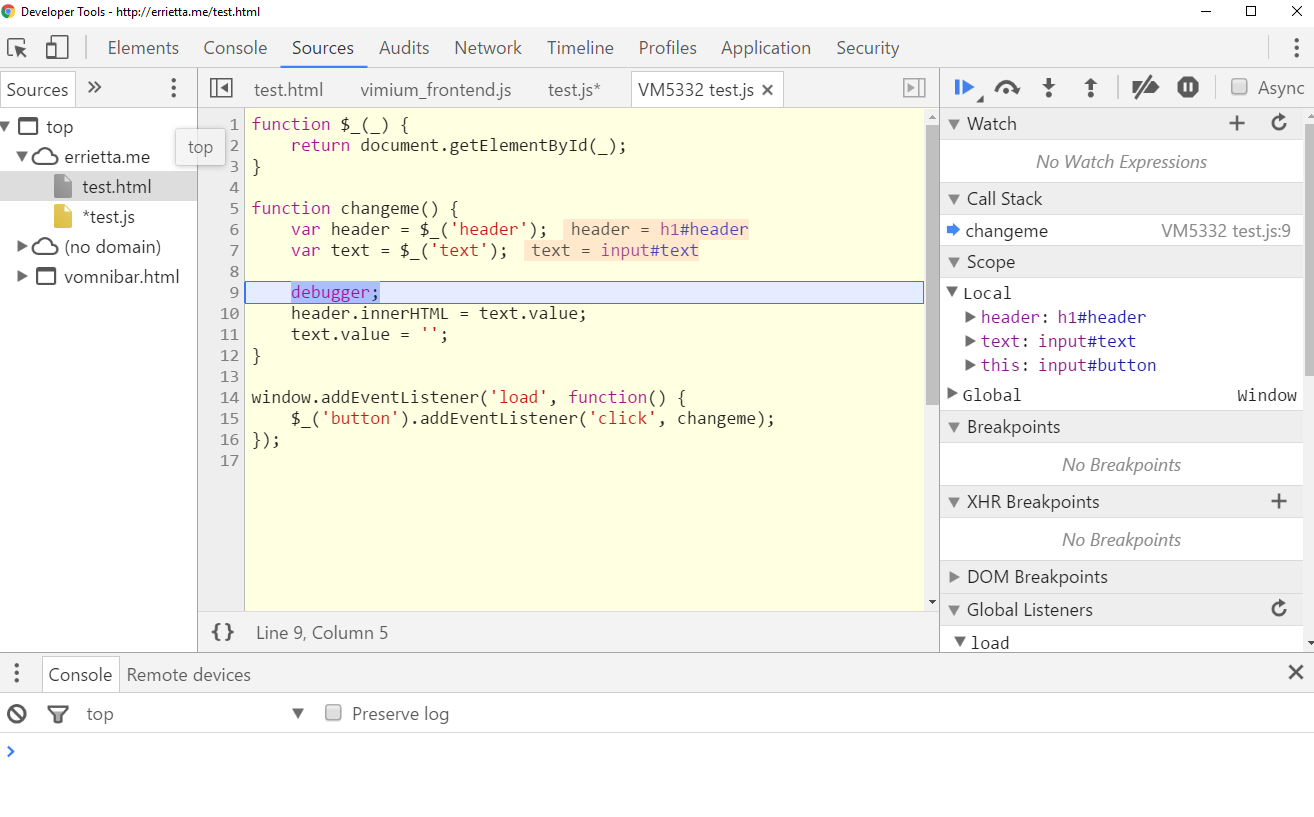
You can do the same by just adding the line ‘debugger;’ anywhere in your code, which I find more convenient some times:
Taking advantage of breakpoints
Ok, so we can add breakpoints, but they’re not much use if we don’t know what to do with them. So what’s the big deal with them?
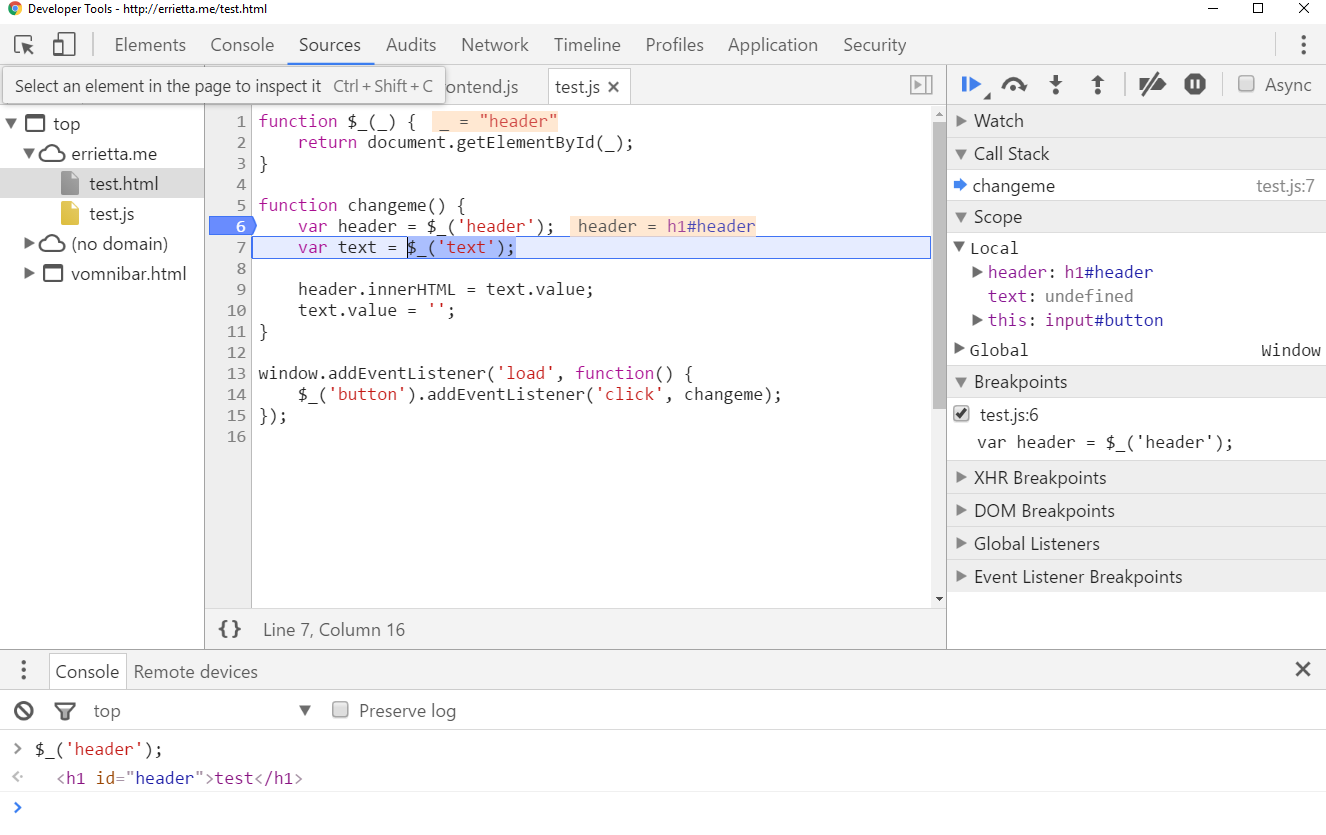
First of all, you can see the value of any part of an expression by highlighting it. For example you can highlight “$_(‘header’)” and see that it has resolved to an element. You can also right click the selected text and click ‘evaluate in console’ to immediatelly run the same expression in the JS console and see its result.
Once you’ve stopped at a break point, you can also break again at the next statement, tracing code statement-by-statement, which is really handy. Let’s look at these buttons:
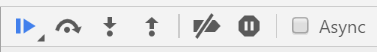
The second and third buttons (‘step over next function call’ and ‘step into next function call’) are what we use to achieve this. Let’s look at their differences.
First of all, the two buttons do the exact same thing if the statement doesn’t call a function: they just evaluate the statement and pause. But in this case, we’re calling the $_ function. If we click the ‘step into next function call’ we’ll see that the debugger will stop ‘inside’ the $_ function and let us debug that function in the same way:
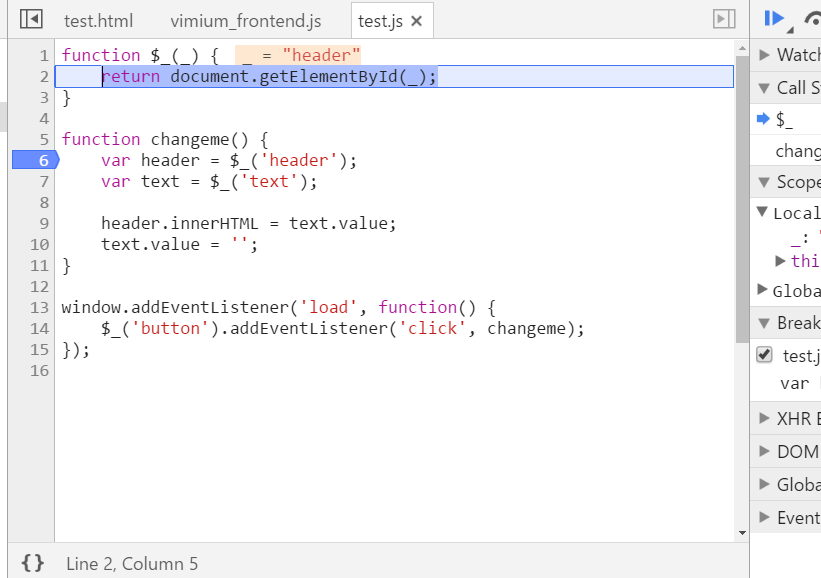
As you can see here we’re now inside the $_ function. We can see the arguments it was called with, and we can use the debugger inside that function the same way. If we keep clicking ‘step into next function’, we’ll eventually go back to changeme() when the function call has finished:
This is a really handy way of tracing what a script does step by step!
If you don’t care what the $_ function does, you could have instead clicked the ‘step over next function call’ button. This will go to the next step in ‘changeme’ immediately, without getting you inside of $_.

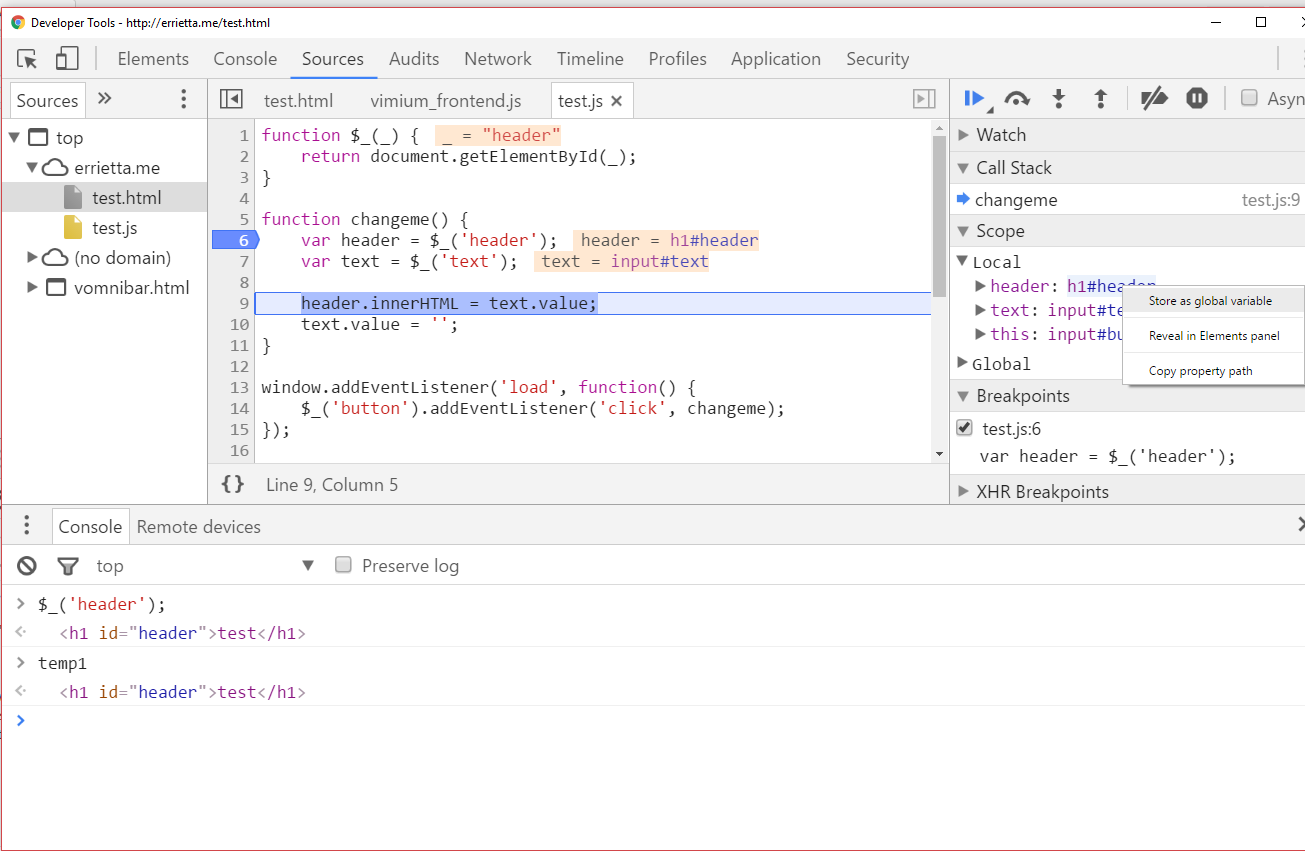
So now our ‘header’ and ‘text’ variables have been set values. You can see in ‘scope’ in the right hand side, all the local and global variables will be listed. This is a very handy way of seeing what the value of a variable is! What’s more you can right click them and click “store as global variable”. This will set them as a global variable and show you that variable in the console (usually temp1, temp2, etc.) and you can then do whatever you want to that variable in your console, which is very useful for debugging
Finally, once you’re done debugging you can click the blue arrow button ![]() to continue execution (until another breakpoint is reached) or this button
to continue execution (until another breakpoint is reached) or this button ![]() to disable any other breakpoints.
to disable any other breakpoints.
That should cover the basics of the JS debugger, but there are more things you can do such as break at specific AJAX requests (XHR breakpoints), or right click an element in the DOM inspector to add a breakpoint when one of its attributes change (which I can’t seem to get to work for some reason), when it gets deleted, or when its children tree changes.
As per usual, let me know if this was helpful, if you have any questions, or if you want me to post more often 😛
Thanks so much